


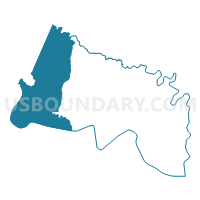
Census Tract 6001, Charles City County, Virginia
About
Outline

Summary
| Unique Area Identifier | 500976 |
| Name | Census Tract 6001 |
| County | Charles City County |
| State | Virginia |
| Area (square miles) | 52.62 |
| Land Area (square miles) | 47.55 |
| Water Area (square miles) | 5.07 |
| % of Land Area | 90.36 |
| % of Water Area | 9.64 |
| Latitude of the Internal Point | 37.38292690 |
| Longtitude of the Internal Point | -77.19395080 |
| Total Population | 2,726 |
| Total Housing Units | 1,227 |
| Total Households | 1,135 |
| Median Age | 46.4 |
Maps

Graphs
Select a template below for downloading or customizing gragh for Census Tract 6001, Charles City County, Virginia


Neighbors
Neighoring Census Tract (by Name) Neighboring Census Tract on the Map
- Census Tract 1004.03, Chesterfield County, VA
- Census Tract 2016.01, Henrico County, VA
- Census Tract 6002, Charles City County, VA
- Census Tract 7001, New Kent County, VA
- Census Tract 7002, New Kent County, VA
- Census Tract 8503.02, Prince George County, VA
- Census Tract 8504, Prince George County, VA
Top 10 Neighboring County Subdivision (by Population) Neighboring County Subdivision on the Map
- Bermuda district, Chesterfield County, VA (66,596)
- Varina district, Henrico County, VA (59,349)
- Bland district, Prince George County, VA (18,192)
- Blackwater district, Prince George County, VA (3,974)
- District 2, New Kent County, VA (3,391)
- District 4, New Kent County, VA (2,921)
- District 1, Charles City County, VA (2,561)
- District 2, Charles City County, VA (2,260)
- Brandon district, Prince George County, VA (1,361)
Top 10 Neighboring Unified School District (by Population) Neighboring Unified School District on the Map
- Chesterfield County Public Schools, VA (316,236)
- Henrico County Public Schools, VA (306,935)
- Prince George County Public Schools, VA (35,725)
- New Kent County Public Schools, VA (18,429)
- Charles City County Public Schools, VA (7,256)
Top 10 Neighboring State Legislative District Lower Chamber (by Population) Neighboring State Legislative District Lower Chamber on the Map
- State House District 97, VA (87,705)
- State House District 74, VA (80,153)
- State House District 62, VA (76,461)
Top 10 Neighboring State Legislative District Upper Chamber (by Population) Neighboring State Legislative District Upper Chamber on the Map
- State Senate District 3, VA (211,723)
- State Senate District 9, VA (201,994)
- State Senate District 13, VA (197,229)
- State Senate District 16, VA (184,330)
Top 10 Neighboring 111th Congressional District (by Population) Neighboring 111th Congressional District on the Map
Top 10 Neighboring 5-Digit ZIP Code Tabulation Area (by Population) Neighboring 5-Digit ZIP Code Tabulation Area on the Map
- 23231, VA (34,685)
- 23860, VA (31,970)
- 23150, VA (12,045)
- 23141, VA (6,471)
- 23140, VA (5,175)
- 23030, VA (5,128)
Data
Demographic, Population, Households, and Housing Units
** Data sources from census 2010 **
Show Data on Map
Download Full List as CSV
Download Quick Sheet as CSV
| Subject | This Area | Charles City County | Virginia | National |
|---|---|---|---|---|
| POPULATION | ||||
| Total Population Map | 2,726 | 7,256 | 8,001,024 | 308,745,538 |
| POPULATION, HISPANIC OR LATINO ORIGIN | ||||
| Not Hispanic or Latino Map | 2,703 | 7,168 | 7,369,199 | 258,267,944 |
| Hispanic or Latino Map | 23 | 88 | 631,825 | 50,477,594 |
| POPULATION, RACE | ||||
| White alone Map | 1,387 | 2,970 | 5,486,852 | 223,553,265 |
| Black or African American alone Map | 1,132 | 3,513 | 1,551,399 | 38,929,319 |
| American Indian and Alaska Native alone Map | 129 | 512 | 29,225 | 2,932,248 |
| Asian alone Map | 12 | 25 | 439,890 | 14,674,252 |
| Native Hawaiian and Other Pacific Islander alone Map | 4 | 5 | 5,980 | 540,013 |
| Some Other Race alone Map | 7 | 40 | 254,278 | 19,107,368 |
| Two or More Races Map | 55 | 191 | 233,400 | 9,009,073 |
| POPULATION, SEX | ||||
| Male Map | 1,349 | 3,567 | 3,925,983 | 151,781,326 |
| Female Map | 1,377 | 3,689 | 4,075,041 | 156,964,212 |
| POPULATION, AGE (18 YEARS) | ||||
| 18 years and over Map | 2,215 | 5,955 | 6,147,347 | 234,564,071 |
| Under 18 years | 511 | 1,301 | 1,853,677 | 74,181,467 |
| POPULATION, AGE | ||||
| Under 5 years | 109 | 306 | 509,625 | 20,201,362 |
| 5 to 9 years | 144 | 352 | 511,849 | 20,348,657 |
| 10 to 14 years | 161 | 386 | 511,246 | 20,677,194 |
| 15 to 17 years | 97 | 257 | 320,957 | 12,954,254 |
| 18 and 19 years | 40 | 157 | 230,008 | 9,086,089 |
| 20 years | 27 | 71 | 117,445 | 4,519,129 |
| 21 years | 27 | 73 | 114,918 | 4,354,294 |
| 22 to 24 years | 76 | 192 | 339,728 | 12,712,576 |
| 25 to 29 years | 149 | 382 | 564,342 | 21,101,849 |
| 30 to 34 years | 144 | 334 | 526,077 | 19,962,099 |
| 35 to 39 years | 130 | 357 | 540,063 | 20,179,642 |
| 40 to 44 years | 190 | 544 | 568,865 | 20,890,964 |
| 45 to 49 years | 269 | 707 | 621,155 | 22,708,591 |
| 50 to 54 years | 275 | 675 | 592,845 | 22,298,125 |
| 55 to 59 years | 279 | 668 | 512,595 | 19,664,805 |
| 60 and 61 years | 91 | 231 | 186,629 | 7,113,727 |
| 62 to 64 years | 104 | 350 | 255,740 | 9,704,197 |
| 65 and 66 years | 76 | 205 | 138,154 | 5,319,902 |
| 67 to 69 years | 80 | 237 | 182,148 | 7,115,361 |
| 70 to 74 years | 91 | 292 | 229,502 | 9,278,166 |
| 75 to 79 years | 71 | 231 | 173,929 | 7,317,795 |
| 80 to 84 years | 65 | 163 | 130,801 | 5,743,327 |
| 85 years and over | 31 | 86 | 122,403 | 5,493,433 |
| MEDIAN AGE BY SEX | ||||
| Both sexes Map | 46.40 | 46.60 | 37.50 | 37.20 |
| Male Map | 45.90 | 45.90 | 36.10 | 35.80 |
| Female Map | 46.80 | 47.20 | 38.70 | 38.50 |
| HOUSEHOLDS | ||||
| Total Households Map | 1,135 | 2,955 | 3,056,058 | 116,716,292 |
| HOUSEHOLDS, HOUSEHOLD TYPE | ||||
| Family households: Map | 783 | 2,107 | 2,047,188 | 77,538,296 |
| Husband-wife family Map | 567 | 1,485 | 1,534,844 | 56,510,377 |
| Other family: Map | 216 | 622 | 512,344 | 21,027,919 |
| Male householder, no wife present Map | 57 | 163 | 133,142 | 5,777,570 |
| Female householder, no husband present Map | 159 | 459 | 379,202 | 15,250,349 |
| Nonfamily households: Map | 352 | 848 | 1,008,870 | 39,177,996 |
| Householder living alone Map | 285 | 697 | 795,117 | 31,204,909 |
| Householder not living alone Map | 67 | 151 | 213,753 | 7,973,087 |
| HOUSEHOLDS, HISPANIC OR LATINO ORIGIN OF HOUSEHOLDER | ||||
| Not Hispanic or Latino householder: Map | 1,126 | 2,926 | 2,895,820 | 103,254,926 |
| Hispanic or Latino householder: Map | 9 | 29 | 160,238 | 13,461,366 |
| HOUSEHOLDS, RACE OF HOUSEHOLDER | ||||
| Householder who is White alone | 601 | 1,277 | 2,221,459 | 89,754,352 |
| Householder who is Black or African American alone | 467 | 1,396 | 572,611 | 14,129,983 |
| Householder who is American Indian and Alaska Native alone | 42 | 204 | 10,213 | 939,707 |
| Householder who is Asian alone | 3 | 5 | 136,006 | 4,632,164 |
| Householder who is Native Hawaiian and Other Pacific Islander alone | 1 | 2 | 1,797 | 143,932 |
| Householder who is Some Other Race alone | 4 | 11 | 61,296 | 4,916,427 |
| Householder who is Two or More Races | 17 | 60 | 52,676 | 2,199,727 |
| HOUSEHOLDS, HOUSEHOLD TYPE BY HOUSEHOLD SIZE | ||||
| Family households: Map | 783 | 2,107 | 2,047,188 | 77,538,296 |
| 2-person household Map | 369 | 1,007 | 860,947 | 31,882,616 |
| 3-person household Map | 208 | 530 | 490,960 | 17,765,829 |
| 4-person household Map | 141 | 362 | 405,593 | 15,214,075 |
| 5-person household Map | 44 | 131 | 178,432 | 7,411,997 |
| 6-person household Map | 11 | 44 | 67,948 | 3,026,278 |
| 7-or-more-person household Map | 10 | 33 | 43,308 | 2,237,501 |
| Nonfamily households: Map | 352 | 848 | 1,008,870 | 39,177,996 |
| 1-person household Map | 285 | 697 | 795,117 | 31,204,909 |
| 2-person household Map | 57 | 133 | 163,694 | 6,360,012 |
| 3-person household Map | 8 | 13 | 29,543 | 992,156 |
| 4-person household Map | 0 | 0 | 14,508 | 411,171 |
| 5-person household Map | 2 | 4 | 3,784 | 126,634 |
| 6-person household Map | 0 | 1 | 1,268 | 48,421 |
| 7-or-more-person household Map | 0 | 0 | 956 | 34,693 |
| HOUSING UNITS | ||||
| Total Housing Units Map | 1,227 | 3,229 | 3,364,939 | 131,704,730 |
| HOUSING UNITS, OCCUPANCY STATUS | ||||
| Occupied Map | 1,135 | 2,955 | 3,056,058 | 116,716,292 |
| Vacant Map | 92 | 274 | 308,881 | 14,988,438 |
| HOUSING UNITS, OCCUPIED, TENURE | ||||
| Owned with a mortgage or a loan Map | 650 | 1,531 | 1,534,437 | 52,979,430 |
| Owned free and clear Map | 296 | 917 | 520,749 | 23,006,644 |
| Renter occupied Map | 189 | 507 | 1,000,872 | 40,730,218 |
| HOUSING UNITS, VACANT, VACANCY STATUS | ||||
| For rent Map | 10 | 23 | 82,493 | 4,137,567 |
| Rented, not occupied Map | 2 | 13 | 5,408 | 206,825 |
| For sale only Map | 15 | 28 | 44,881 | 1,896,796 |
| Sold, not occupied Map | 4 | 6 | 9,570 | 421,032 |
| For seasonal, recreational, or occasional use Map | 17 | 63 | 80,468 | 4,649,298 |
| For migrant workers Map | 0 | 0 | 608 | 24,161 |
| Other vacant Map | 44 | 141 | 85,453 | 3,652,759 |
| HOUSING UNITS, OCCUPIED, AVERAGE HOUSEHOLD SIZE BY TENURE | ||||
| Total: Map | 2.40 | 2.46 | 2.54 | 2.58 |
| Owner occupied Map | 2.45 | 2.48 | 2.60 | 2.65 |
| Renter occupied Map | 2.17 | 2.33 | 2.41 | 2.44 |
| HOUSING UNITS, OCCUPIED, TENURE BY RACE OF HOUSEHOLDER | ||||
| Owner occupied: Map | 946 | 2,448 | 2,055,186 | 75,986,074 |
| Householder who is White alone Map | 517 | 1,031 | 1,625,387 | 63,446,275 |
| Householder who is Black or African American alone Map | 369 | 1,167 | 284,139 | 6,261,464 |
| Householder who is American Indian and Alaska Native alone Map | 39 | 186 | 5,779 | 509,588 |
| Householder who is Asian alone Map | 3 | 5 | 88,158 | 2,688,861 |
| Householder who is Native Hawaiian and Other Pacific Islander alone Map | 0 | 1 | 927 | 61,911 |
| Householder who is Some Other Race alone Map | 3 | 7 | 23,675 | 1,975,817 |
| Householder who is Two or More Races Map | 15 | 51 | 27,121 | 1,042,158 |
| Renter occupied: Map | 189 | 507 | 1,000,872 | 40,730,218 |
| Householder who is White alone Map | 84 | 246 | 596,072 | 26,308,077 |
| Householder who is Black or African American alone Map | 98 | 229 | 288,472 | 7,868,519 |
| Householder who is American Indian and Alaska Native alone Map | 3 | 18 | 4,434 | 430,119 |
| Householder who is Asian alone Map | 0 | 0 | 47,848 | 1,943,303 |
| Householder who is Native Hawaiian and Other Pacific Islander alone Map | 1 | 1 | 870 | 82,021 |
| Householder who is Some Other Race alone Map | 1 | 4 | 37,621 | 2,940,610 |
| Householder who is Two or More Races Map | 2 | 9 | 25,555 | 1,157,569 |
| HOUSING UNITS, OCCUPIED, TENURE BY HISPANIC OR LATINO ORIGIN OF HOUSEHOLDER | ||||
| Owner occupied: Map | 946 | 2,448 | 2,055,186 | 75,986,074 |
| Not Hispanic or Latino householder Map | 939 | 2,430 | 1,980,873 | 69,617,625 |
| Hispanic or Latino householder Map | 7 | 18 | 74,313 | 6,368,449 |
| Renter occupied: Map | 189 | 507 | 1,000,872 | 40,730,218 |
| Not Hispanic or Latino householder Map | 187 | 496 | 914,947 | 33,637,301 |
| Hispanic or Latino householder Map | 2 | 11 | 85,925 | 7,092,917 |
| HOUSING UNITS, OCCUPIED, TENURE BY HOUSEHOLD SIZE | ||||
| Owner occupied: Map | 946 | 2,448 | 2,055,186 | 75,986,074 |
| 1-person household Map | 219 | 523 | 445,994 | 16,453,569 |
| 2-person household Map | 369 | 986 | 751,259 | 27,618,605 |
| 3-person household Map | 174 | 456 | 358,425 | 12,517,563 |
| 4-person household Map | 124 | 309 | 301,012 | 10,998,793 |
| 5-person household Map | 41 | 116 | 125,353 | 5,057,765 |
| 6-person household Map | 9 | 31 | 45,267 | 1,965,796 |
| 7-or-more-person household Map | 10 | 27 | 27,876 | 1,373,983 |
| Renter occupied: Map | 189 | 507 | 1,000,872 | 40,730,218 |
| 1-person household Map | 66 | 174 | 349,123 | 14,751,340 |
| 2-person household Map | 57 | 154 | 273,382 | 10,624,023 |
| 3-person household Map | 42 | 87 | 162,078 | 6,240,422 |
| 4-person household Map | 17 | 53 | 119,089 | 4,626,453 |
| 5-person household Map | 5 | 19 | 56,863 | 2,480,866 |
| 6-person household Map | 2 | 14 | 23,949 | 1,108,903 |
| 7-or-more-person household Map | 0 | 6 | 16,388 | 898,211 |
Loading...